Graphs templates
Browse our free templates for graphs designs you can easily customize and share.


Graphs by Playground
Graphs are fundamental tools for visualizing data, making complex information easy to understand and interpret. Whether you're a student, a data analyst, a business professional, or a researcher, graph templates can save you time and effort in creating visually appealing and accurate representations of your data. From line graphs and bar charts to pie charts and scatter plots, these templates cater to a multitude of use cases. They are ideal for presentations, reports, academic projects, or even for personal use, such as tracking your fitness progress or financial milestones. Playground offers a comprehensive collection of graph templates that are free and easy to use. With our intuitive platform, you can quickly find the perfect template to match your needs. Each template is expertly designed to ensure clarity and professionalism, allowing you to focus on what matters most—analyzing and presenting your data. Playground caters to users of all skill levels, making it simple for anyone to create beautiful, informative graphs without any design experience. Plus, every graph template on Playground is customizable so you can tweak it to fit your specific needs, whether that involves changing colors, fonts, or data sets. Once you've selected and personalized your graph template, sharing your work is a breeze. Playground allows you to export your finished graph in multiple formats, making it easy to embed in presentations, reports, or even share on social media. Additionally, you can make a wide array of edits to ensure that your graph perfectly fits your vision. With Playground's user-friendly tools and extensive library of graph templates, creating stunning data visualizations has never been easier. Dive in today and discover how our free templates can transform the way you present data.
Browse templates
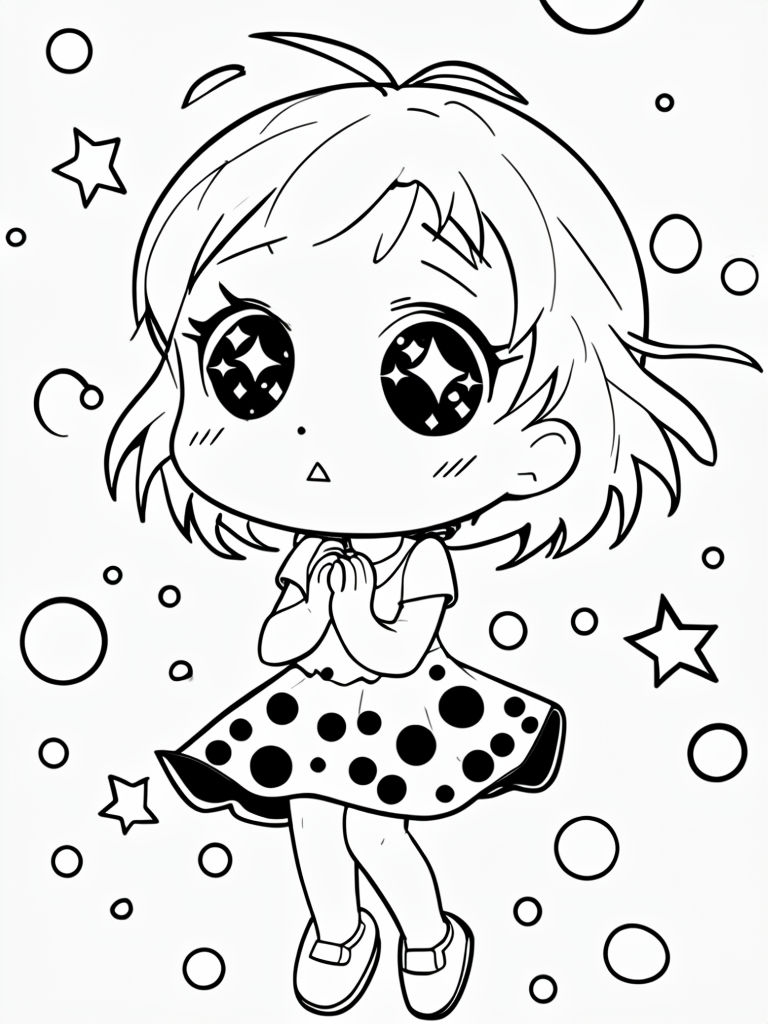
- Cute Girl Ai
- Warning Sign
- Beige Background
- Neon Background
- Flower Bouquet Drawing
- Couple
- Hotel Visiting Card
- Anime Girl With Attitude
- Engagement Invitation Card
- Recommendation
- Human
- Street Lamp Night
- Church
- Logo
- Retro
- Gambar
- Rare Toons India
- Christmas Wishes
- Christmas Invitation
- Love Frame
- Congratulations Clip Art
- Chair Png
- Workshop
- Cartoon Man